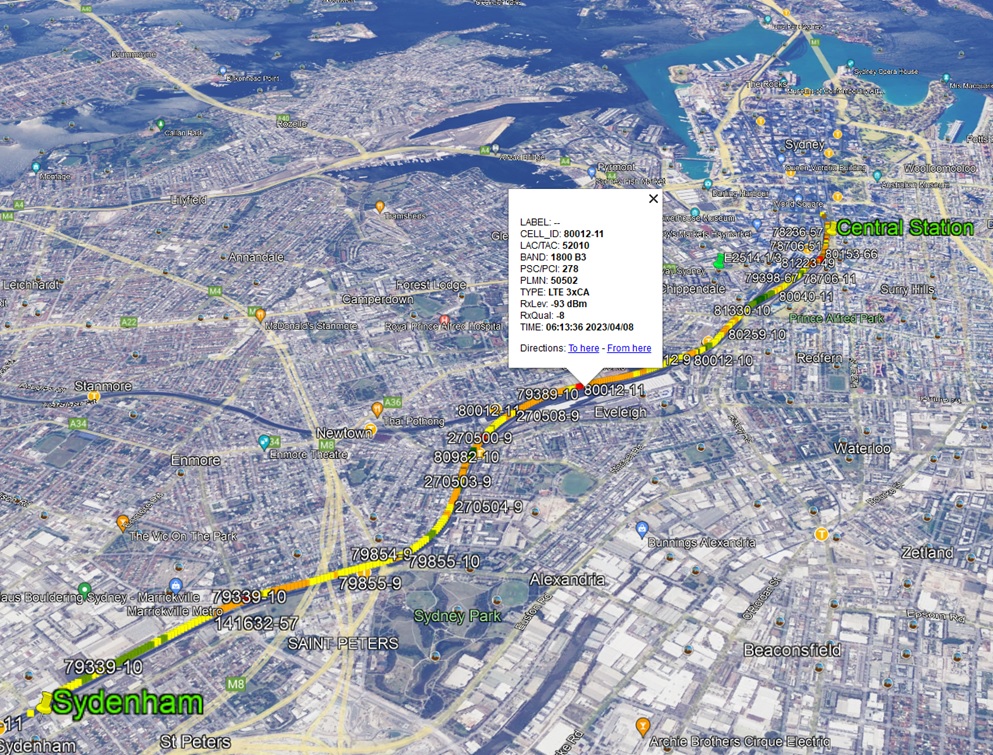

Drone-based RF scanning
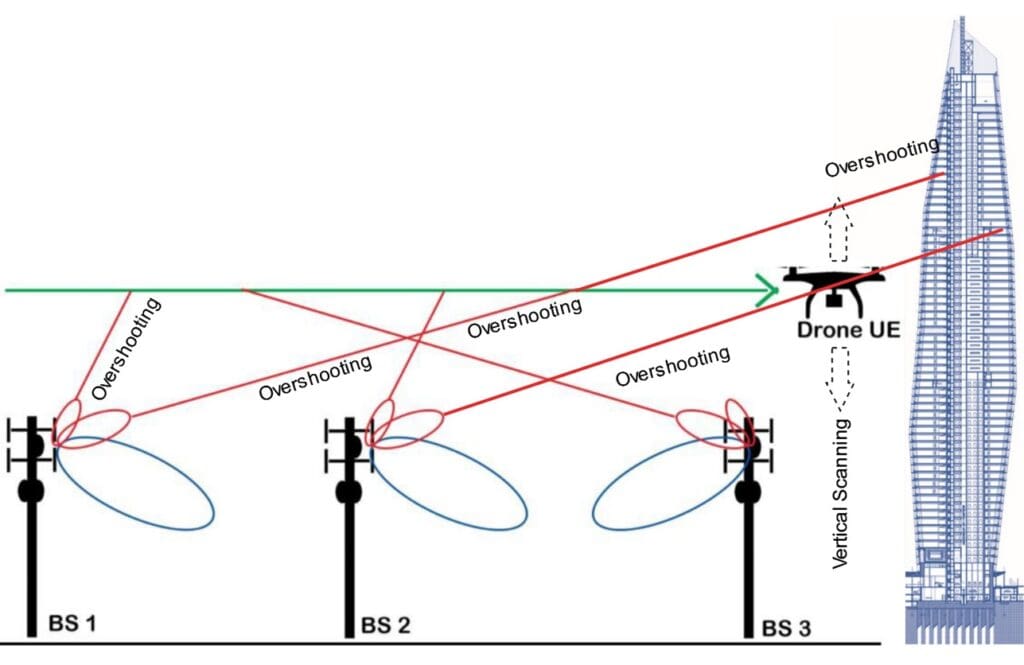
- Conducting vertical RF scanning through an equipped drone.

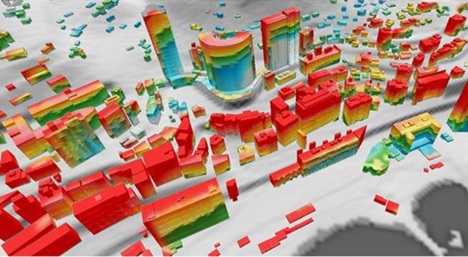
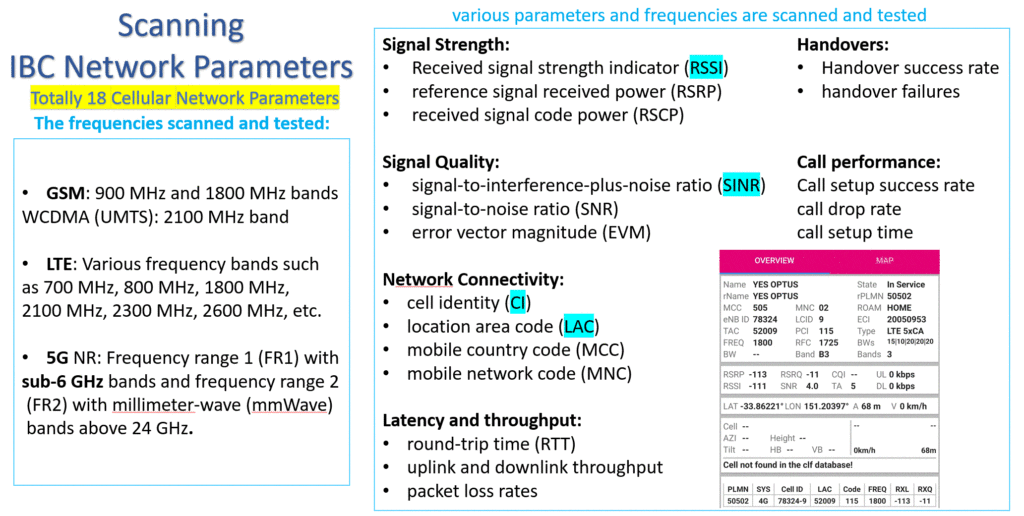
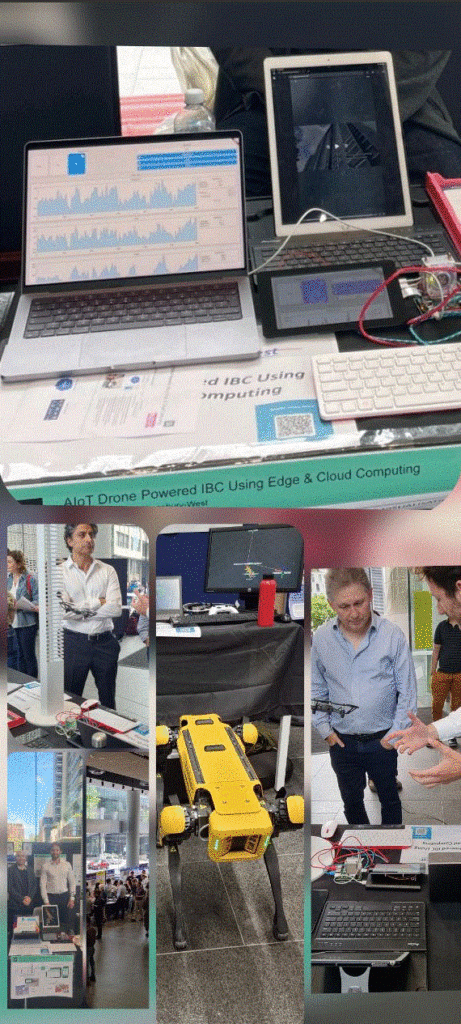
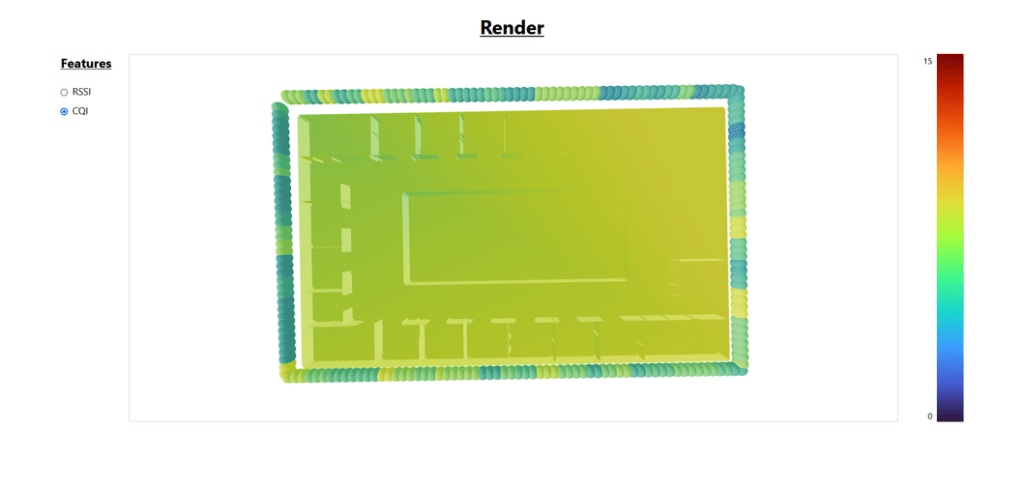
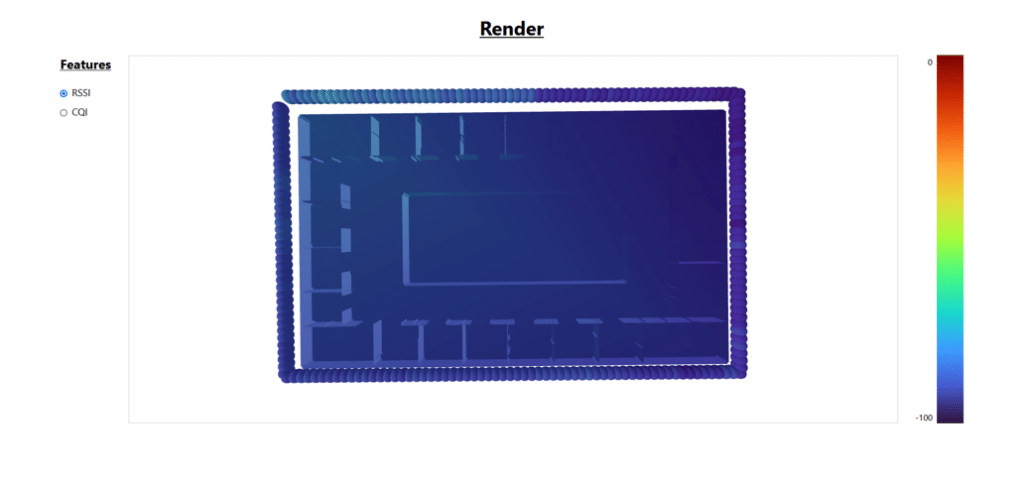
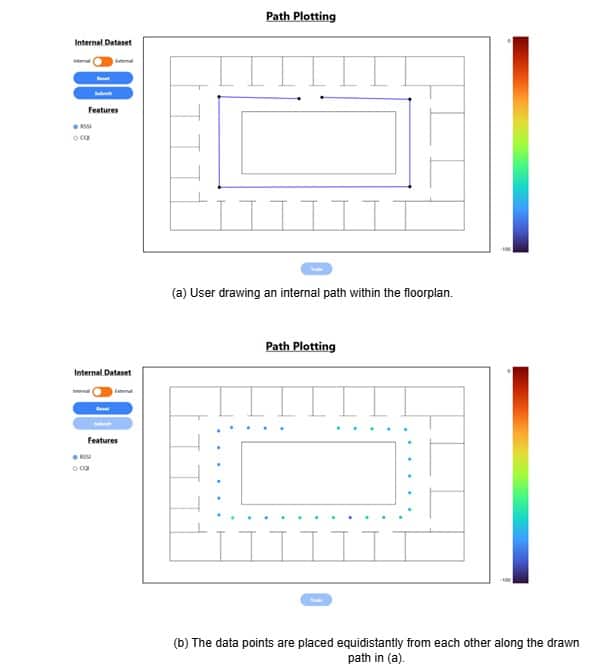
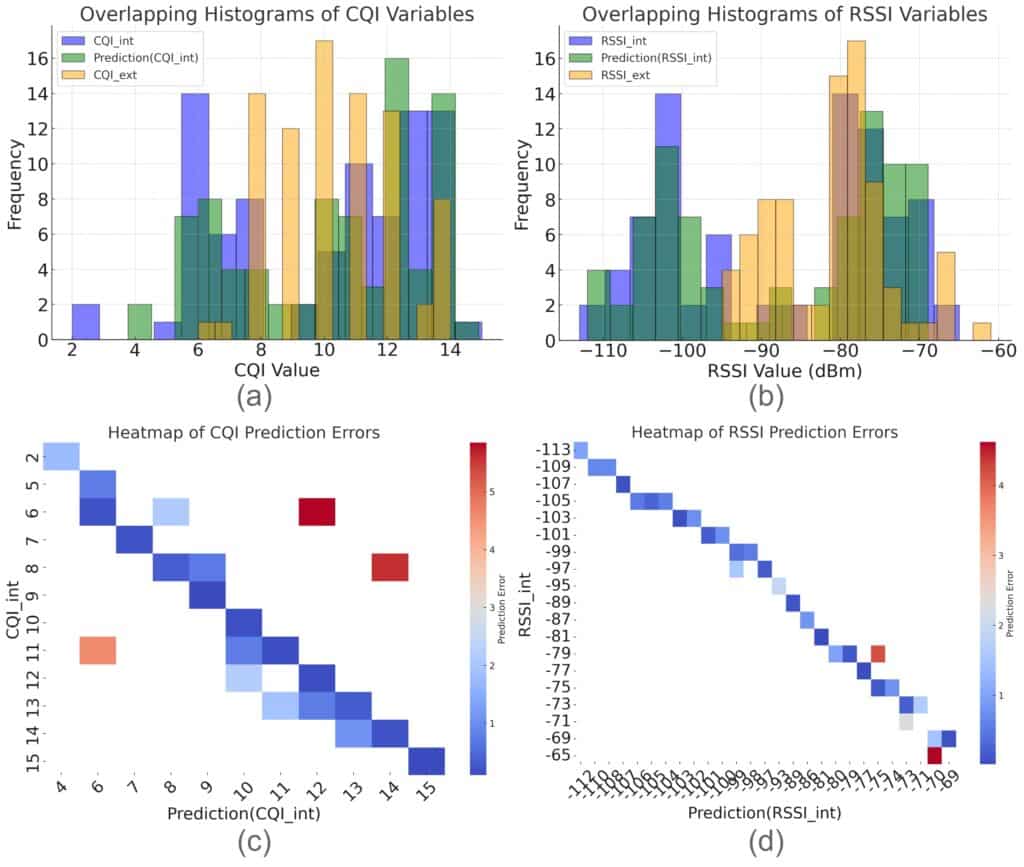
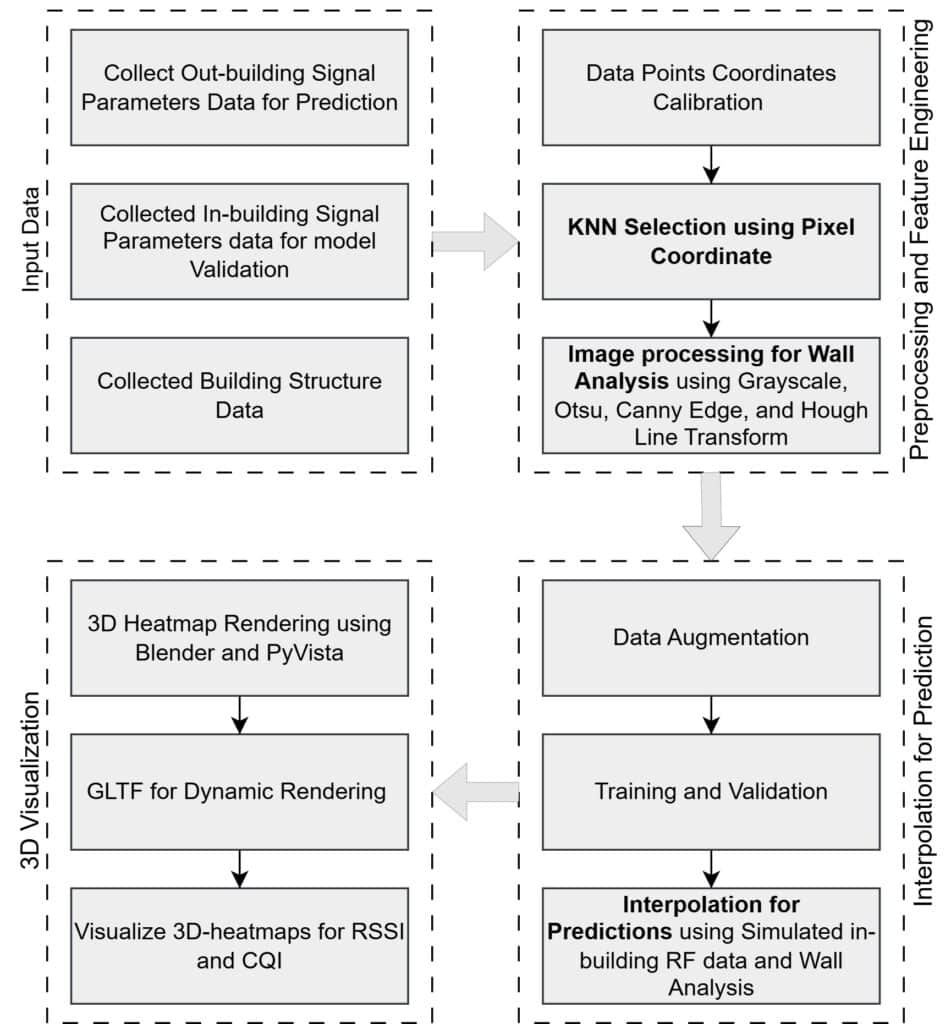
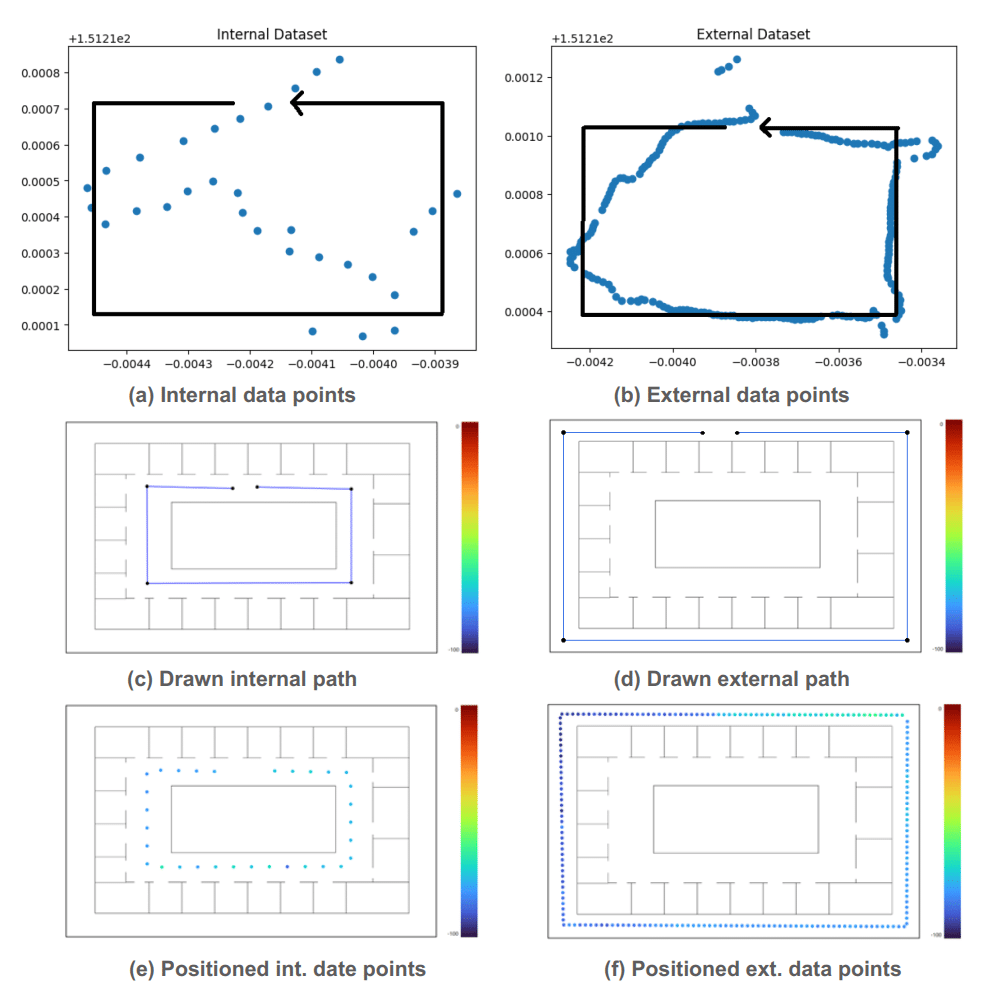
For the first time, this research project introduces a drone-based methodology for 5G network scanning of macrocell signals reception outside buildings to predict and visualize in-building 3D coverage (IBC) signals. Unlike traditional approaches reliant on labor-intensive indoor walk tests, this method optimizes time and cost associated with pre-technical site surveys for IBC solutions. The proposed framework leverages out-building RF datasets collected by drones programmed circularly flying around high-rise structures, capturing 5G signal performance parameters such as RSSI, RSRP, RSRQ, CQI, and SNR. Advanced feature engineering integrates performance feature data augmentation, spatial data, free-space path loss, and material-specific attenuation with our proposed interpolation technique to train a location-aware deep neural network capable of predicting indoor signal performance metrics. The resulting in-building coverage data is visualized using a 3D heatmap tool, enabling a detailed representation of indoor signal propagation across multiple levels. Validation with walk-test data demonstrates the method’s accuracy and robustness. The novel approach enables quick, scalable, and cost-efficient pre-technical assessments by eliminating the need for extensive indoor measurements and enhancing the feasibility of commercial IBC deployments. In this study, we propose an AIoT-enabled drone-based methodology for in-building signal coverage prediction in high-rise environments. Our approach involves drone-assisted RF data collection or out-building dataset, which is processed using machine learning models to infer indoor signal conditions. By integrating macro cell measurements with floor-specific building structural data, the system predicts indoor coverage and visualizes it in 3D heatmaps, offering actionable insights to enhance IBC performance.
Key contributions of this study include:
This project outcome bridges the gap between external RF scanning and indoor coverage optimization, presenting a cost-effective and scalable solution for improving IBC in high-rise buildings. This makes the project highly relevant and potentially transformative in the commercial sphere.
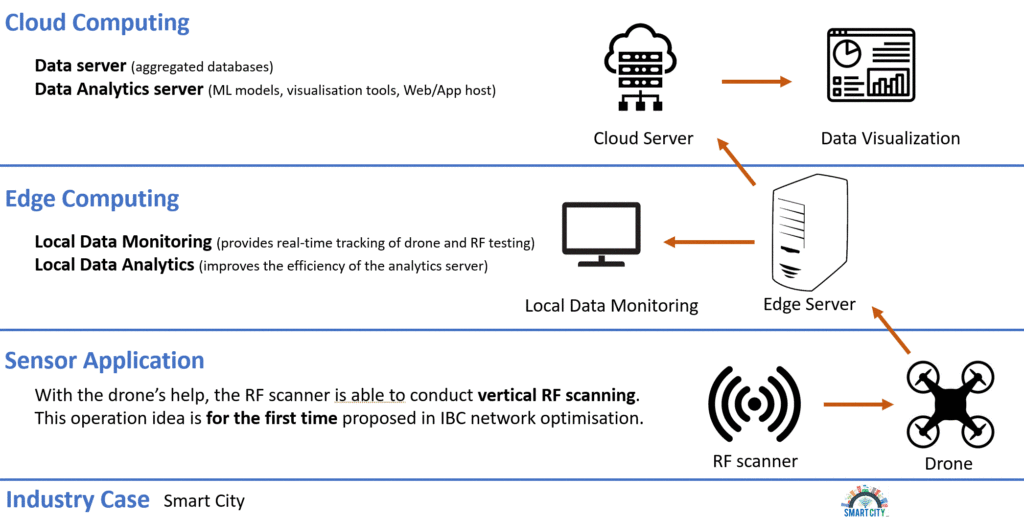
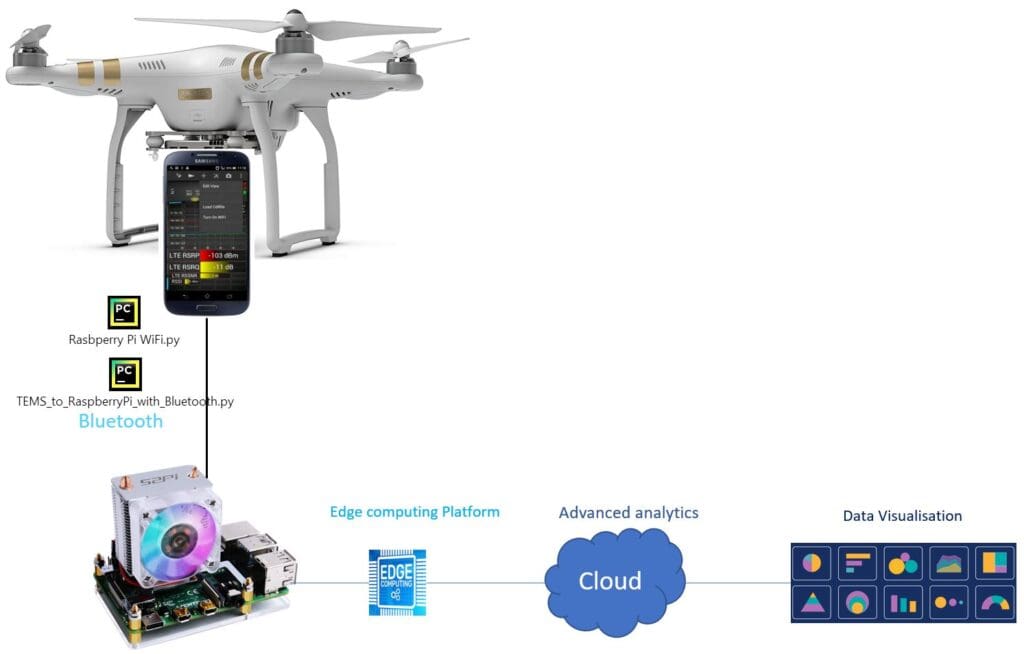


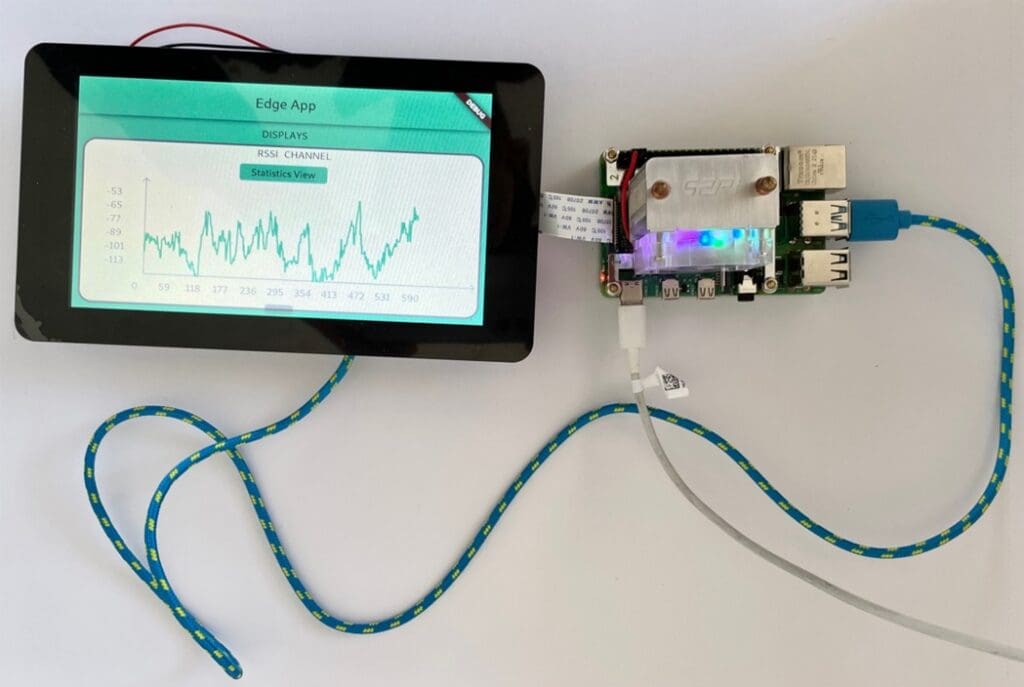
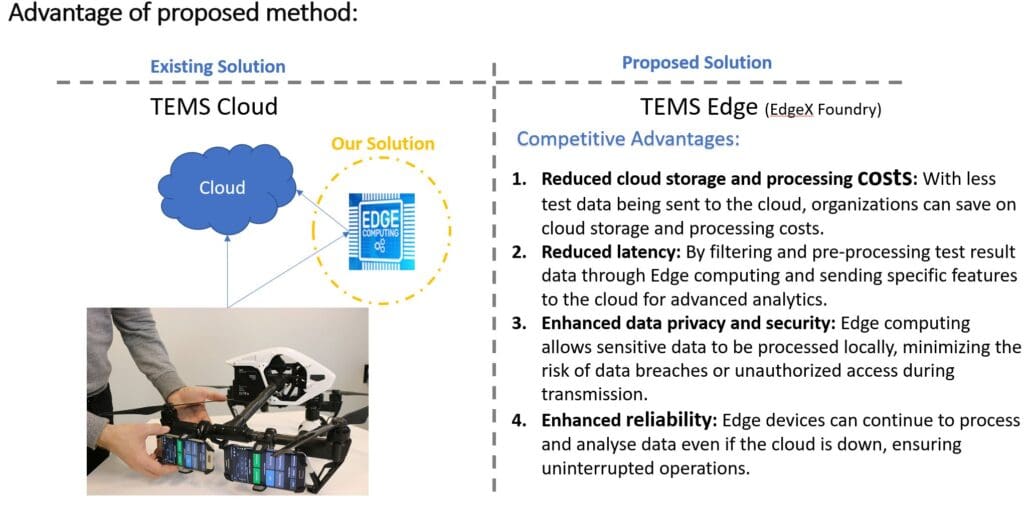
EDGE data acquisition






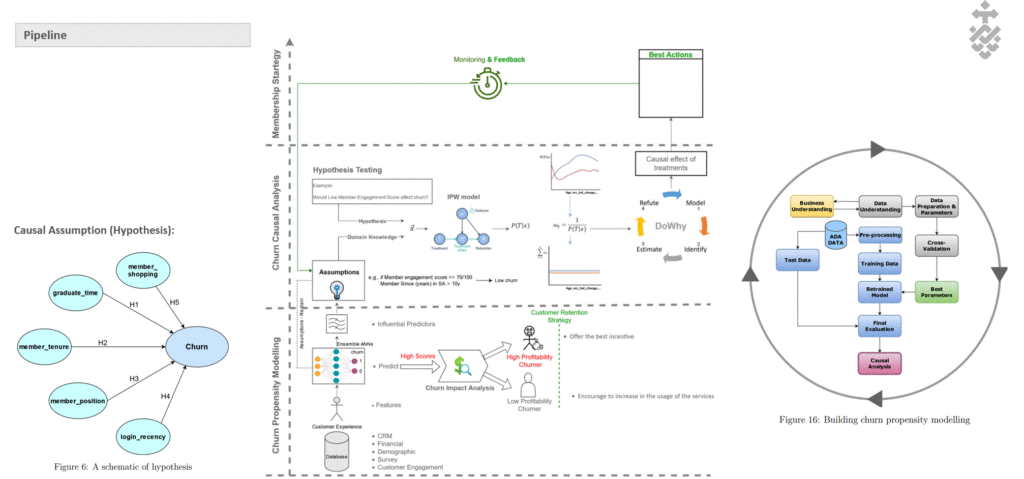
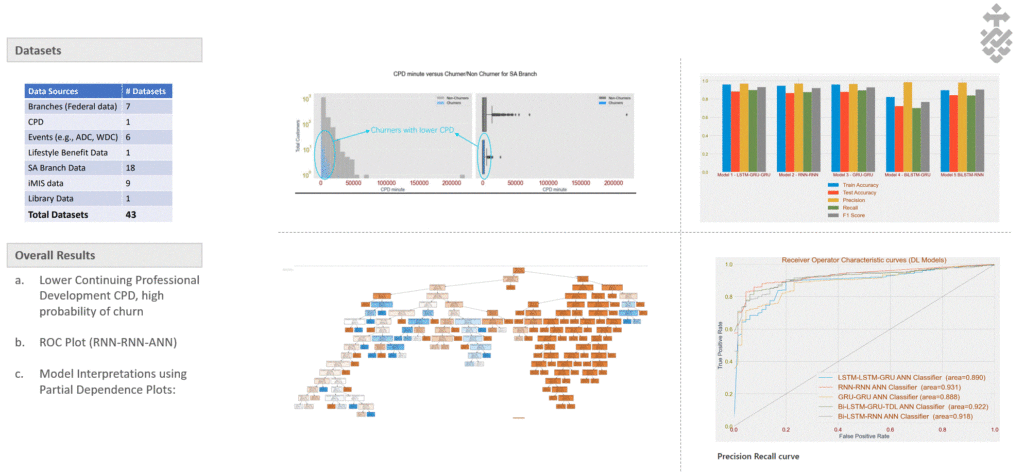
Customer churn describes terminating a relationship with a business or reducing customer engagement over a specific period. Customer acquisition cost can be five to six times that of customer retention, hence investing in customers with churn risk is wise. Causal analysis of the churn model can predict whether a customer will churn in the foreseeable future and identify effects and possible causes for churn. In general, this study presents a conceptual framework to discover the confounding features that correlate with independent variables and are causally related to those dependent variables that impact churn. We combine different algorithms including the SMOTE, ensemble ANN, and Bayesian networks to address churn prediction problems on a massive and high-dimensional finance data that is usually generated in financial institutions due to employing interval-based features used in Customer Relationship Management systems.
The effects of the curse and blessing of dimensionality assessed by utilising the Recursive Feature Elimination method to overcome the high dimension feature space problem. Moreover, a causal discovery performed to find possible interpretation methods to describe cause probabilities that lead to customer churn. Evaluation metrics on validation data confirm the random forest and our ensemble ANN model, with %86 accuracy, outperformed other approaches. Causal analysis results confirm that some independent causal variables representing the level of super guarantee contribution, account growth, and account balance amount were identified as confounding variables that cause customer churn with a high degree of belief. This article provides a real-world customer churn analysis from current status inference to future directions in local superannuation funds.


Customer closing account or showing reduced transactions/interactions over a set period.

Stops the business from becoming a "revolving door.“ and preserves revenue.

(a) No studies found linking causal analysis with client attrition in superannuation fund(s). (b) Most research focuses on churn prediction rather than causality analysis of customer churn.

(a) Integrating RFE, SMOTE, and Ensemble ANN to address high-sparsity datasets. (b) Enhanced identification of causal effects and refined initial assumptions.

To address the complexity of the ANNs model, a causal inference model is proposed to identify churn effects of treatments and describe cause probabilities that lead to churn.

(a) Predicting potential churner within the next 6 months. (b) Causal Inference Model with IPW emphasising key robust Estimands.
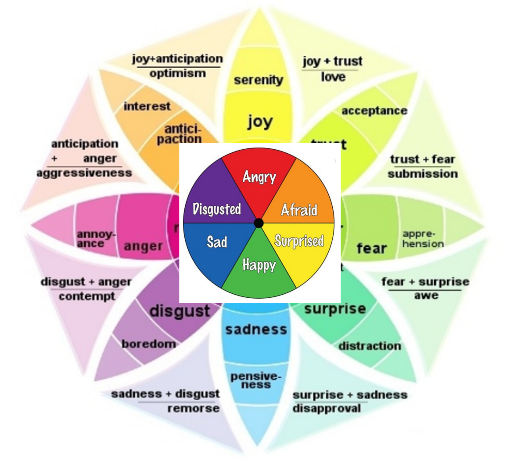
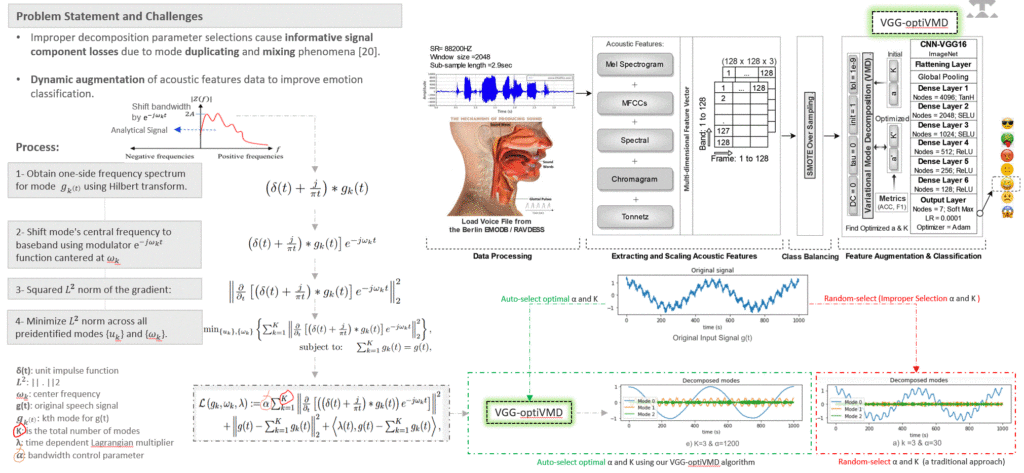
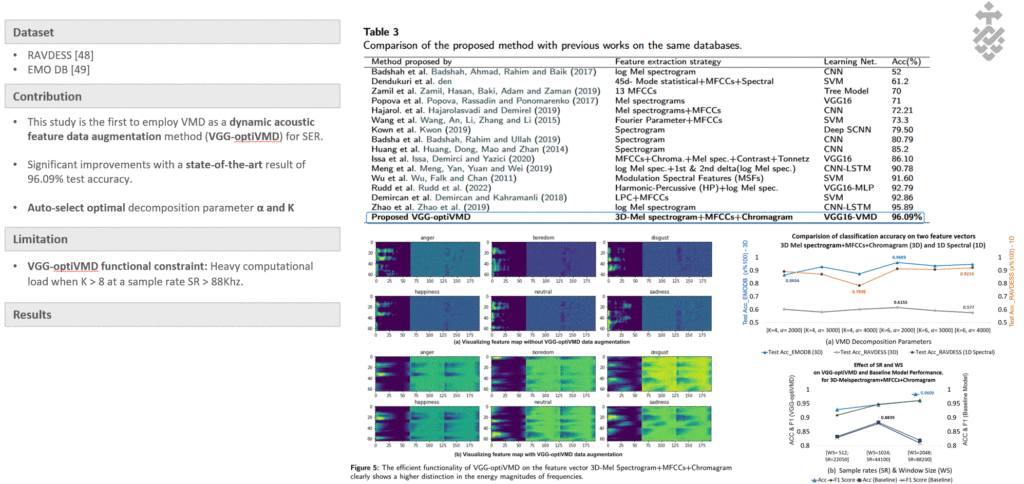
Emotion recognition (ER) from speech signals is a robust approach since it cannot be imitated like facial expression or text based sentiment analysis. Valuable information underlying the emotions are significant for human-computer interactions enabling intelligent machines to interact with sensitivity in the real world. Previous ER studies through speech signal processing have focused exclusively on associations between different signal mode decomposition methods and hidden informative features. However, improper decomposition parameter selections lead to informative signal component losses due to mode duplicating and mixing. In contrast, the current study proposes VGG-optiVMD, an empowered variational mode decomposition algorithm, to distinguish meaningful speech features and automatically select the number of decomposed modes and optimum balancing parameter for the data fidelity constraint by assessing their effects on the VGG16 flattening output layer.
Various feature vectors were employed to train the VGG16 network on different databases and assess VGG-optiVMD reproducibility and reliability. One, two, and three-dimensional feature vectors were constructed by concatenating Mel-frequency cepstral coefficients, Chromagram, Mel spectrograms, Tonnetz diagrams, and spectral centroids. Results confirmed a synergistic relationship between the fine-tuning of the signal sample rate and decomposition parameters with classification accuracy, achieving state-of-the-art 96.09% accuracy in predicting seven emotions on the Berlin EMO-DB database.
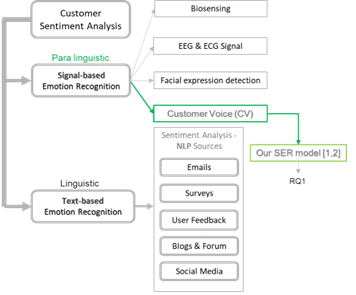

Negative emotions in calls indicate potential customer dissatisfaction and churn.


The objective of this training estimate (task-1) is to predict the account balance of an bank customer with dataset in 2016 and 2017 using Pythonv 3.7. The dataset wa sourced from the CFD which is one of the largest company in supperannuation in Australia. This report is organized as follows:
1- Overview section describes the dataset used and the features in this dataset.
2- Data Preparation section covers data cleaning and data preparation steps.
3- Data Exploration section explores dataset features and their inter-relationships.
4- Methodology section describes how to estimate the customer’s account balance in the retirement age 67 and Program flowchart.
5- Summary and Conclusions section provides a summary of our work and presents our findings.
The CFD datasets provide two dataset features_201612.xlsx and features_201712.xlsx with a lot of features (culomns), but only age, current_balance, ID and SEIFA Index were useful in this project. The feature_description_jb.xlsx file contains the details of the variables (features or attributes). The dataset has 214296 observations. In this project, we use the dataset ” features_201612.xlsx” only to calcualte median growrth instances to growth_lastyear. You can find further information in methodology section.
Our goal is to see if we can predict an individual’s account balance in retired age 67 years within an acceptable increase or decrease in comparison with the amount of current account balance. we will predict account balance in age 67 based on the amount of median growth of the account balance in previous years and curent customer’s account balance.
Our target feature is account balance in age 67 years.
The variable descriptions below are from the feature_description_jb.xlsx file:
gender: Female, Male
age: customer age
acc_balance: account balance
acc_balance_201612: account balance in 2016
acc_balance_201712: current account balance in 2017
growth_lastyear: Median growth of customer account balance
seifa: SEIFA Index number between 1 and 10. Socio-Economic Indexes for Areas
postcode: Postcode
By utilizing the median growth of previous account balances, we can project the account balance at retirement age. However, our approach has certain limitations, particularly for customers who are outliers or exhibit significant fluctuations in their account balances. While it proves effective for the majority of cases, a valuable next step would be to introduce interaction terms and consider incorporating additional features, such as the SEIFA index, to enhance the accuracy of our predictions. For instance, we could create a new variable derived from the SEIFA index number, which we could designate as the “SEIFA coefficient.”
Also, read https://davidhason.com/downloads/
