22.01.2026

GenAI Unleashed: From Sci-Fi Dream to Reality (and All the Drama In Between!)

I. Introduction: Meet Your New AI Overlord (Just Kidding… Mostly!)

Remember those halcyon days when artificial intelligence was relegated to the realm of speculative fiction, gracing the silver screens of science fiction? Those days are gone. GenAI is not just a concept anymore; it’s here, churning out everything from catchy advertising jingles that burrow into your subconscious to award-worthy art that challenges our very notion of creativity. Welcome, dear reader, to the brave new world of Generative AI!

In this post, we’re not just dipping our toes; we’re diving headfirst into the swirling waters of GenAI. We’ll explore its essence, trace its lineage, dissect the cacophony of opinions surrounding it (both the utopian and dystopian), confront the ethical quagmires, and, if we dare, peek into the looking glass to glimpse its nascent future.

II. What Exactly IS GenAI Anyway? (The Basics, Decoded)

Forget the AI of yesteryear, the number-crunching, data-analyzing automatons of old. GenAI isn’t just smart; it’s creative. It doesn’t simply regurgitate information; it generates entirely new content.

Imagine, if you will, an artificial intelligence capable of penning a novel that rivals Tolstoy, painting a masterpiece that would make Van Gogh weep with envy, composing a symphony that would stir the soul like Beethoven, editing a video with the finesse of Hitchcock, or even coding your next killer app – all from a single, well-crafted prompt. That, in essence, is the promise of GenAI.

And the magic behind this sorcery? It’s a complex brew, primarily powered by deep learning models, with the reigning champions being Large Language Models (LLMs), the innovative Generative Adversarial Networks (GANs), and a dash of that revolutionary concept called transformer architecture.

Let’s demystify the jargon, shall we?

  • LLMs: Think of them as the silver-tongued orators of the AI world, the verbose cousins of tools like ChatGPT.
  • Multimodal AI: These are the true polymaths, juggling text, images, and sound with equal aplomb.
  • Agentic AI: Imagine a future populated by super-powered digital assistants that can autonomously tackle multi-stage tasks on your behalf.
  • SLMs: The streamlined, agile kin of the LLMs, perfect for tasks requiring speed and efficiency.

III. A Whirlwind Tour Through GenAI’s Past: From Talking Bots to Global Phenomenon

Our journey begins not with silicon and code, but with pure, unadulterated thought.

  • The OG Days (1950s-1970s):
    • Before the advent of the computer age, there existed ideas. The Turing Test, for instance, a philosophical gauntlet thrown down to challenge the very definition of intelligence.
    • Then came ELIZA (1960s): a rudimentary chatbot that, remarkably, managed to convince some users that it was a genuine psychotherapist.
    • And let’s not forget AARON (1973): an AI artist that produced original artwork. A testament to creative AI.
  • The Neural Network Nudge (1980s-1990s):
    • The emergence of algorithms like backpropagation marked a turning point, enabling more sophisticated neural network training.
    • Furthermore, the invention of LSTMs, granted AI the ability to remember and process complex sequences, which was essential for language processing.
  • The Deep Learning Boom (2010s):
    • Fueled by a convergence of factors – exponential increases in computing power and the availability of massive datasets – AI experienced a renaissance.
    • VAEs & GANs (2013-2014): AI learned the art of creating realistic images.
    • Transformers (2017): The crucial ingredient that unlocked the true potential of LLMs.
    • GPT-1 (2018): OpenAI’s inaugural foray into the realm of conversational AI.
  • The Mainstream Takeover (2020s):
    • GPT-3 (2020): Text generation of an unprecedented quality.
    • DALL-E (2021): The birth of text-to-image generation.
    • ChatGPT (2022): The inflection point when GenAI burst into the public consciousness, igniting a global conversation.
    • GPT-4, Gemini, Claude (2023): The titans of AI engaging in a relentless battle for supremacy.
    • 2024-2025: A surge in multi-modal capabilities, the emergence of video generation, and the rise of AI agents.

IV. GenAI in the Hot Seat: What Everyone’s Saying (and Doing) Right Now (2024-2025)

  • The Experts’ Verdict: Less Hype, More “Get Stuff Done”:
    • Your Future Personal Assistant: By 2028, Agentic AI is poised to influence approximately 15% of our daily work decisions.
    • Economic Boom: Estimates predict that GenAI could add trillions to the global economy, with 80% of U.S. jobs experiencing increased efficiency.
    • Job Juggling: Not outright job losses for everyone, but a definite shift in job roles is coming.
    • Industry Revolution: From finance to healthcare, education to the arts, GenAI is poised to transform every sector of the economy.
    • The Catch: CIOs are concerned about security, data privacy, and the environmental impact.
  • The Public’s Pulse: “Cool, But I Don’t Quite Trust It Yet”:
    • Everyone’s Trying It: From 2024 to 2025, ChatGPT usage nearly doubled.
    • Info Junkies: The primary use case for GenAI among the general public is information retrieval.
    • Benefits vs. Headaches: While most recognize the potential benefits of GenAI, skepticism regarding the ethics and data protection practices of AI companies is on the rise.
    • Fake News Fears: Trust in AI-generated news remains low.
    • Job Worries: Concerns about AI-driven job displacement are more pronounced among the public.
    • Global Divide: Optimism regarding GenAI varies significantly across different countries, with women generally exhibiting greater levels of apprehension.

V. The Storm Clouds Gather: GenAI’s Biggest Controversies

  • Ethical Headaches: When AI Goes Rogue:
    • Bias & Discrimination: AI systems, trained on inherently biased data, can perpetuate and even amplify existing societal biases.
    • Deepfakes & Disinformation: The ability to generate hyper-realistic fake videos and audio poses a grave threat to truth and trust.
    • Privacy Nightmares: The ethical implications of training AI models on vast quantities of internet data are profound.
    • Environmental Footprint: The energy and water consumption associated with training and running these powerful AI models is a growing concern.
  • Legal Battles: The Copyright Wars Heat Up:
    • Artists & Authors Fight Back: A wave of lawsuits has been filed against AI companies by artists, authors, and media organizations.
    • Music Mayhem: Major music labels are taking legal action against AI music generators.
    • Who Owns AI Art? Current legal precedent suggests that human involvement is necessary for copyright protection.
    • Deepfakes & Impersonation: Lawsuits highlight the ease of creating fake voices.
  • Technical Tribulations: When AI Just… Fails:
    • “Hallucinations”: The tendency of AI models to generate false or nonsensical information.
    • Cybersecurity Threats: AI can be wielded as a potent weapon by malicious actors.
    • The “Black Box” Problem: The opacity of complex AI models makes it difficult to understand and rectify errors.

VI. Gazing into the Crystal Ball: The Future of GenAI (2025 & Beyond!)

  • Cool Stuff on the Horizon:
    • Seamless Multi-talented AI: AI systems capable of seamlessly integrating text, video, audio, and code.
    • AI That Gets You: User interfaces that adapt to your behavior, AI agents that understand natural language commands in real-time.
    • Hyper-Personalization: The ability to deliver highly personalized experiences based on individual preferences.
    • Beyond Content: AI accelerating drug discovery, designing robots, and simulating scenarios.
    • Cheaper & Greener: Innovations aimed at making GenAI more affordable and sustainable.
  • The Big Picture: AI as Fundamental as Electricity:
    • AI Everywhere: GenAI will become an ubiquitous technology.
    • Humans Still Steering: Human oversight and critical thinking will remain essential.
    • Emerging Frontiers: Quantum AI, AI integrating with Web3, and AI developing emotional intelligence.
    • Global Reach: GenAI will expand into new markets and address societal challenges.

VII. Final Thoughts: Navigating the GenAI Revolution

GenAI presents us with a double-edged sword, offering immense potential for innovation and efficiency, while simultaneously posing profound ethical, legal, and technical challenges.

The path forward requires continuous learning, adaptation, and open dialogue about the kind of AI future we wish to create. The future is generating itself before our very eyes.

3D Indoor 5G Mapping via Dynamic Graph Attention Networks You can find the full video on YouTube : - ZeroHuman AI channel - https://lnkd.in/gfm-x5Nz - Channel handle: @ZeroHuman2033 and - Channel ID: UC2tUIcMEE3y93D9g9pu_xcg
AI Agents in Action: You can find the full video content on my YouTube channel: https://www.youtube.com/@zerohuman2033 with channel ID: UC2tUIcMEE3y93D9g9pu_xcg
Taming the Digital Deluge: You can find the full video content on my YouTube channel: https://www.youtube.com/@zerohuman2033 with channel ID: UC2tUIcMEE3y93D9g9pu_xcg
SpiderGNN Seeing 5G Signal Through Walls : You can find the full video content on my YouTube channel: https://www.youtube.com/@zerohuman2033 with channel ID: UC2tUIcMEE3y93D9g9pu_xcg

18/12/2025

The Machiavellian Playbook: 4 Surprising Truths About Power You Need to Know

Have you ever wondered about the unspoken social grammars that dictate who rises and who falls in professional and social hierarchies? We are conditioned to operate on a set of common-sense beliefs about influence: work hard, be transparent, never give up, and always show your best side. But what if these widely held principles are not just incomplete, but strategically disadvantageous?
The anatomy of power is a complex psychological game, often operating on deeply counterintuitive principles. Thinkers who have dedicated their lives to studying its mechanisms, like Robert Greene, have revealed that the path to influence is paved with strategies that defy conventional wisdom. These aren’t about grand, overt gestures, but about subtle, calculated actions that shift the balance of control by leveraging the predictable patterns of human nature.
This analysis will explore four such principles that challenge our most basic assumptions about interaction. By observing these rules in action, you will gain a new lens through which to view your professional and personal life, revealing the psychological levers that operate just beneath the surface. Prepare to see the world of power in a completely new light.

When You’re Weak, Surrender is Your Strongest Move

According to Law 22, one must “Use the surrender tactic: transform weakness into power.” When you are in a demonstrably weaker position, fighting back out of a sense of honour is a grave error that often leads to total annihilation. A futile confrontation not only exhausts your limited resources but also strengthens your opponent by exposing your stubbornness and giving them an easy victory.
Surrender, in this context, is not defeat; it is a strategic tool for survival. By yielding, you deny your opponent the satisfaction of crushing you. More importantly, it buys you invaluable time—time to recover, to observe, and to wait for your opponent’s power to decline inevitably. Consider ancient Athens after its devastating loss to Sparta in the Peloponnesian War. Instead of fighting to the last man, Athens surrendered. This act preserved its cultural and intellectual core, allowing it to recover and eventually outlast the more militaristic but less resilient Spartan empire. Athens transformed its military weakness into a source of enduring influence.
This principle is a lesson in strategic patience and resource preservation, concepts central to game theory. It reframes surrender from a moral failing to a calculated move designed to reset the game board. The “never give up” mentality is admirable in the abstract, but the game of power is a marathon. This tactic is about choosing your battles wisely to win the war, rather than losing everything over a single, unwinnable fight.
By surrendering, you deny your rival the satisfaction of victory. You give yourself time to recover, to wait for their power to wane, and to prepare for your eventual return. It is an instrument of power, not a sign of its absence.

Don’t Build a Fortress; It’s a Prison

Law 18 states, “Do not build fortresses to protect yourself – isolation is dangerous.” The world can feel threatening, and the instinct to retreat into a secure “fortress”—whether physical or social—is a natural one. It promises safety from perceived enemies.
However, a fortress cuts you off from the flow of valuable intelligence, leaving you blind to shifting alliances and emerging threats. It makes you a conspicuous and stationary target for your enemies. True protection comes not from walls, but from circulation. China’s first emperor, Qin Shi Huang, became obsessed with security and built a network of secret tunnels between his palaces. His isolation fed his paranoia, cut him off from reliable information, and ultimately weakened the dynasty he fought so hard to build. He had created the ultimate fortress, but it was a prison that guaranteed his eventual downfall.
This principle reveals that power is a function of social capital and network theory. Influence depends on connections and information flow; isolation starves an individual of both. Fighting our instinct to withdraw during times of threat is critical, as power relies on being among people, using the crowd as a shield, and maintaining access to the vital intelligence that only social circulation can provide.
A fortress may feel safe, but it cuts you off from the flow of information and makes you a conspicuous target. True safety lies not in isolation, but in the crowd—in alliances and awareness. The herd is your shield.

Never Appear Too Perfect

Law 46 warns, “Never appear too perfect.” While appearing superior to others is a dangerous game, appearing to be without faults or weaknesses is the most dangerous posture of all. Perfection doesn’t inspire admiration; it creates envy, the most silent and insidious of emotions. Envy breeds enemies who will work to undermine you in subtle ways.
It is far more strategic to display harmless defects or occasionally admit minor vices. This makes you appear more human, approachable, and less intimidating. When the architect Jules Hardouin-Mansart presented his plans for the Grand Trianon at Versailles to King Louis XIV, he deliberately included a small, easily corrected flaw in the garden design. The King, a keen amateur architect, immediately spotted it and suggested the correction. Mansart exclaimed with admiration at the King’s brilliance, making his superior feel clever and insightful. By seeming less than perfect, Mansart secured the King’s approval and strengthened his own position.
This tactic leverages a psychological quirk known as the “pratfall effect,” where displaying a minor flaw can increase one’s appeal and relatability. It shifts the dynamic from managing a threat to building rapport. This is especially difficult for high achievers, but it underscores a critical component of power: managing others’ emotions is as important as demonstrating your own competence.
To appear to have no faults or weaknesses is to invite envy, the most insidious of enemies. It is far wiser to display a few harmless defects, making you seem more human and approachable and allowing others to feel superior in some small way.

Always Say Less Than Necessary

According to Law 4, “Always say less than necessary.” Power, in many aspects, is a game of appearances. When you attempt to impress with words, the more you say, the more common you appear, and the less you seem to be in control. You also increase the likelihood of saying something foolish or revealing information that could be used against you.
Influential people impress and intimidate by saying less. When your statements are brief and ambiguous, others rush to interpret them. They project their own thoughts and insecurities onto your silence, revealing their own intentions and weaknesses. King Louis XIV was a master of this tactic. When courtiers would petition him, he would often respond with a noncommittal, “I shall see.” This vague phrase would send them into a frenzy of interpretation, forcing them to reveal more about their own ambitions and alliances as they tried to decipher his meaning. His silence made them uncomfortable, and in their haste to fill it, they gave him a strategic advantage.
This is a masterclass in creating information asymmetry. Silence forces the other party to lay their cards on the table, allowing you to react with the benefit of superior knowledge. Our culture often equates verbosity with confidence, but this rule demonstrates that immense power comes from restraint. The less you say, the lower the risk of a misstep and the less chance others have of penetrating your intentions.
When you try to impress people with words, the more you say, the more common you appear. Powerful people impress and intimidate by saying less. The more you say, the more likely you are to say something foolish.
The dynamics of power are rarely straightforward. As these principles demonstrate, the most effective strategies are often psychological and run contrary to our natural instincts and societal conditioning. Understanding that surrender can be strength, isolation is danger, imperfection is a shield, and silence is a weapon provides a new framework for navigating human interaction. These are not rules for the faint of heart, but they are the psychological levers that operate beneath the surface of social hierarchies.


13/12/2025

Your Drone’s GPS Is Easy to Fool. Here’s How AI Catches It in the Act.

The sight of a drone in the sky is becoming increasingly common. These cellular-connected Unmanned Aerial Vehicles (UAVs) are critical tools for everything from target searching and emergency rescue to network recovery after a disaster. But for all their advanced capabilities, they rely on a surprisingly fragile technology for navigation: the Global Positioning System (GPS). Civilian GPS signals are unencrypted, making them easy for an attacker with low-cost tools to “spoof”—tricking a drone into thinking it’s somewhere it isn’t.

You might think the solution is simple: just use the drone’s onboard sensors or cameras to double-check its location. But these common-sense approaches have critical and surprising flaws that can render them useless. A novel solution, however, sidesteps these issues by turning the drone’s cellular connection into a powerful security tool. By using the cellular network’s own signals as a source of truth, a new system can not only detect a GPS spoofing attack in real-time but also pinpoint the drone’s actual location.

——————————————————————————–

1. The Five Most Surprising Takeaways on Securing Drones from GPS Attacks

1.1. Takeaway 1: Your Drone’s Onboard Sensors Can’t Always Be Trusted

While drones are equipped with an Inertial Navigation System (INS) containing sensors like accelerometers and gyroscopes, these are not a foolproof defense against GPS spoofing. Their primary weakness is a problem known as “integration drift,” where tiny measurement errors accumulate over time. Think of it like a tiny, one-degree error in a compass; over a mile, you’d be hundreds of feet off course. For a drone’s sensors, these errors happen thousands of times per second, leading to a complete loss of position awareness in a short amount of time. These sensors are also sensitive to temperature changes, further degrading their accuracy.

Using a camera for visual localization seems like a good alternative, but this method is easily hampered by poor weather like clouds or rain. Furthermore, external factors like vibrations, magnetic fields, and electromagnetic interference can also degrade a camera’s performance, making it an unreliable witness.

As researchers note, the physical limitations are significant:

“…IMU sensors are useful for measuring acceleration and angular velocity, they have limitations such as the issue of integration drift that causes measurement errors to accumulate over time, resulting in inaccurate readings.”

1.2. Takeaway 2: The Solution is a “Digital Twin” of the Airwaves

The core of this new security method is a highly detailed, 3D “radio map.” You can think of this as a virtual model or “digital twin” of the radio environment in a specific area, like an urban canyon. For any given 3D coordinate, the map can provide the theoretical Received Signal Strength (RSS) a drone should be getting from a cellular base station at that exact spot. This map becomes the “ground truth” against which the drone’s reported location can be verified.

Creating this map is remarkably efficient. Instead of the impossible task of measuring the signal at every single point in a city, the system uses a simulated “ray-tracing” model—which calculates the path of radio waves as they bounce off, pass through, and bend around buildings—for a few sample points. It then uses a powerful statistical interpolation method called “Kriging” to accurately fill in the rest of the map. This efficiency is a game-changer because it bypasses the need for expensive, purpose-built hardware or massive, city-wide surveying campaigns, making it a practical and scalable software solution. The study found that a specific technique, Universal Kriging (UK) with an exponential covariance function, produced the most accurate radio map with the lowest standard errors.

1.3. Takeaway 3: AI Plays “Spot the Difference” with Radio Signals

With the 3D radio map as a reliable reference, machine learning models can be trained to act as vigilant watchdogs. The logic is straightforward: the AI constantly compares the real-time cellular signal strength the drone is actually receiving with the theoretical signal strength it should be receiving (according to the radio map) for its reported GPS position. If there’s a significant mismatch between the real and theoretical values, the system flags a potential spoofing attack.

The researchers tested several types of artificial neural networks, including Multi-Layer Perceptrons (MLP), Convolutional Neural Networks (CNN), and Recurrent Neural Networks (RNN). An interesting trade-off emerged: while the MLP model achieved the highest detection accuracy, the CNN model delivered comparable performance with less training time. This is because the CNN could process the raw RSS data directly. This ability is a significant advantage in edge computing scenarios, where pre-processing can introduce latency—a critical factor when detecting a real-time attack on a fast-moving drone.

1.4. Takeaway 4: Finding the Drone’s Real Location is a High-Tech Search & Rescue

Detecting an attack is only half the battle. To regain control and prevent disaster, the system must also find the drone’s true physical location. For this, a method called a “particle filter” is used.

Once an attack is detected, the system generates a cloud of hundreds of possible locations, or “particles,” where the drone might actually be. The system then evaluates this cloud of possibilities against the drone’s actual signal history. Particles whose signal paths don’t match reality are discarded, while those that align are reinforced and used to generate the next, more accurate cloud of guesses. This process allows the system to rapidly zero in on the drone’s true position.

1.5. Takeaway 5: This System is Impressively Fast and Accurate

This entire detection and mitigation process is not just theoretical; it’s highly effective. By combining the 3D radio map, a trained neural network, and the particle filter, the system can thwart a GPS spoofing attack with remarkable speed and precision.

Using 100 particles, the system can successfully relocate the drone to its real position with an error margin of only 10 meters, and it can accomplish this in under a minute. Furthermore, the study shows that by increasing the number of particles to 200, the estimation error can be reduced to less than 4 meters, offering an even higher degree of precision where required. This level of speed and accuracy is the difference between an attacker successfully crashing a drone into a building and an operator safely regaining control with enough time to avert disaster.

——————————————————————————–

2. Conclusion: A New Blueprint for Drone Security

The key takeaway is that the infrastructure needed to better secure our skies already exists. By leveraging the ever-present cellular network and creating a “digital twin” of its radio environment, we can build a powerful, software-based security system for UAVs. This approach adds a robust layer of protection that doesn’t require redesigning GPS satellites or installing expensive new hardware on the drones themselves. It’s an elegant solution that turns a drone’s basic connectivity into its own best defense.

As we deploy more autonomous systems into the world, what other existing infrastructures could be repurposed to keep them safe and secure?

This is exactly the kind of innovation the telecom space has been waiting for. SpiderGNN tackles the indoor-coverage bottleneck with a level of precision that traditional methods simply can't match. The dynamic graph construction and topology-aware encoding are genuinely standout ideas, and the accuracy gains speak for themselves. This is the direction indoor RF mapping should be heading. #5GInnovation #GraphNeuralNetworks #AIResearch #TelecomEngineering #IndoorCoverage #SmartConnectivity #UAVData #WirelessNetworks #FutureTech

12/12/2025

Why Your 5G Fails Indoors—And How an AI is Learning to See Through Walls

The Invisible Problem with Indoor 5G

We’ve all experienced it: the lightning-fast 5G connection you have on the street evaporates the moment you step inside a large building. That seamless video call stutters, and the download grinds to a halt. This isn’t just a minor annoyance; it’s a major bottleneck in our wireless infrastructure, especially considering that over 80% of all mobile data traffic originates from within buildings. For network operators, ensuring strong, reliable indoor coverage is a critical and persistent challenge.

Traditionally, mapping indoor signal strength required “walk tests,” where technicians manually walk through every floor of a building with specialized equipment—a process that is painfully slow, labor-intensive, and completely impractical for the thousands of high-rises in a modern city. While drones, or Unmanned Aerial Vehicles (UAVs), can easily scan a building’s exterior, they can’t see inside. This has left engineers with a fundamental puzzle.

This leads to a critical and largely unsolved problem: How can one infer the unobservable indoor signal environment based solely on externally collected UAV data? A new AI framework called SpiderGNN offers a surprising and powerful answer by teaching a machine to think less like a surveyor with a ruler and more like a radio wave itself.

For Radio Waves, Physical Proximity is a Lie

The first step to solving the indoor signal puzzle is to unlearn a basic assumption we make about the physical world: that things that are close together are related. In the complex radio environment inside a building, this simply isn’t true. Two points just a few feet apart might have drastically different signal strengths if one is on the other side of a steel-reinforced concrete wall.

This is what researchers call a “non-Euclidean” problem. The straight-line distance (Euclidean distance) between two points is far less important than the actual path a radio wave can travel between them. Obstacles like walls, floors, elevator shafts, and even fireproofing materials create a complex maze that defies simple geometric rules.

As the researchers state, this mistaken assumption is the fatal flaw in simpler models:

In indoor environments, physical adjacency does not guarantee radio accessibility. Structural obstructions such as walls, floors, elevator shafts, and fireproofing layers may completely sever signal paths between nearby locations.

The AI Learns the ‘Signal Map,’ Not the Floor Plan

Most AI models that try to map spaces create a graph by connecting nearby points, essentially overlaying a grid on the physical world. As we just learned, this is the wrong approach for radio signals. The key innovation of the SpiderGNN model is that it doesn’t rely on a pre-defined map based on physical distance.

Instead, SpiderGNN uses a technique called “Dynamic Graph Construction.” In simple terms, the AI isn’t given a floor plan to work with; it learns the map of signal relationships from the data itself. It does this by calculating a “relevance score” between every single point, then connecting each point only to its “top-k” most similar partners, regardless of where they are in the building.

This means the AI builds its own understanding of how radio waves actually behave in that specific environment. It might discover that a point on the north side of the 5th floor has a strong signal relationship with a point on the south side of the 7th floor because they share an open atrium, a connection that a human—or a model based on proximity—would completely miss. In essence, the AI is not given a map based on flawed Euclidean assumptions; it is forced to discover the true non-Euclidean signal topology on its own.

Predicting Signal Strength and Quality are Two Different Jobs

A good connection isn’t just about signal strength; it’s also about signal quality. SpiderGNN recognizes this by treating them as two distinct prediction tasks. The model measures both RSSI (Received Signal Strength Indicator), which is the raw power of the signal, and CQI (Channel Quality Indicator), which is a more nuanced measure of the connection’s capacity and reliability.

The model uses “Dual Prediction Branches” because these two metrics behave differently. Think of RSSI as the volume of a conversation—it gets quieter the farther away you are. CQI is the clarity—it can be ruined by echoes, background noise, or other people talking, even if the volume is high. SpiderGNN understands that you need to listen for volume and clarity in two different ways. By creating a specialized branch for each task, the model can capture the unique physics governing both phenomena.

To ensure the final predictions are as robust as possible, the framework adds a final quality-control step called a “Meta-Ensemble Fusion Layer.” Instead of trusting a single AI’s prediction, the system trains multiple versions of SpiderGNN independently. It then feeds all their predictions to a “manager” AI (like XGBoost or Ridge regression) that analyzes the consensus and makes a final, more reliable prediction. This transforms the model from a “magic box” into a well-engineered, fault-tolerant system.

The Results are Staggeringly Accurate

The theoretical approach is elegant, but the real-world performance is what matters. In tests on a real-world multi-story hotel in central Sydney, SpiderGNN didn’t just outperform the previous baseline model, the Location-Aware Deep Neural Network (LA-DNN); it achieved a level of accuracy that makes it a genuinely practical tool.

Here are the key performance metrics from the study:

  • RSSI (Strength) Error Reduction: 76% improvement over the LA-DNN baseline.
  • CQI (Quality) Error Reduction: 89% improvement over the baseline.
  • Goodness of Fit (R²): Above 0.99 for both metrics, meaning the model’s predictions explain over 99% of the variation in the real-world indoor signals.
  • CQI Correlation: Jumped from a very low 0.213 in the baseline to a near-perfect 0.998, showing an almost one-to-one relationship between predicted and true quality.

In plain English, these numbers mean the model can create a picture of the indoor signal environment with extremely high fidelity, using only data collected by a drone flying outside the building.

From Numbers to an Actionable 3D Signal Map

The final piece of the puzzle is turning all this complex data into something a network engineer can actually use. The SpiderGNN framework’s final output is not a spreadsheet of numbers, but an interactive 3D visualization of the building’s signal coverage.

The model’s predictions are mapped onto a 3D model of the building, creating what is effectively a “three-dimensional heatmap” of 5G coverage. Just like a weather map, it uses a simple color code: cooler colors like blue and green represent weak signals, while warmer colors like yellow and red show where the signal is strong.

Crucially, this entire process is incredibly fast. The framework can generate a complete 3D coverage map for a multi-story building in well under a minute, with the AI inference for a dense 900-point grid on a single floor taking only 0.2 seconds on a GPU. This transforms abstract prediction data into an intuitive and powerful diagnostic tool. Network engineers can instantly rotate the model, slice through floors, and visually identify the exact rooms, corners, or corridors that are coverage blind spots, allowing for precise and efficient network optimization.

Seeing the Invisible

The breakthrough of SpiderGNN lies in its humility. Instead of arrogantly assuming that physical distance dictates signal behavior, it assumes it knows nothing. Its power comes from learning the building’s true signal pathways—its hidden radio topology—from scratch. This shift from a rigid model of geometry to a learned model of topology (how things are connected) provides a powerful new lens to see the invisible.

This approach allows us to map an invisible signal field with incredible precision from the outside, solving a major challenge in modern wireless networking. It also leaves us with a compelling question: What other invisible, complex systems in our world—from urban traffic flows to environmental pollution—could we begin to understand and optimize by learning their hidden connections?

12 December 2025

The modern data journey, from OLTP to cloud-scale analytics, showcases ETL, data warehouses, NoSQL, and secure VPC architectures.

hashtagDataAnalytics hashtagCloudComputing hashtagETL hashtagDataEngineering hashtagBigData hashtagNotebookLM

  1. OLTP (Online Transaction Processing)

  2. ETL (Extract, Transform, Load)

  3. Data Warehouse

  4. OLAP (Online Analytical Processing)

  5. Big Data & NoSQL Storage

  6. Cloud Integration

  7. Virtual Private Cloud (VPC)

  8. Cloud Service Models (IaaS, PaaS, SaaS)

26/11/2025

The New Rules of Work: 5 Counterintuitive Truths to Future-Proof Your Career

If you feel a sense of anxiety and uncertainty about your professional future, you’re not alone. The ground beneath our feet is shifting. The forces of globalization and technology have permanently altered the labor market, rendering the traditional “career ladder”—a predictable, linear ascent within a single organization—obsolete. It has been replaced by a landscape that is more dynamic, fractured, and unpredictable.

Navigating this new reality requires treating your career as an entrepreneurial venture. The old advice no longer applies. To succeed as the CEO of “You, Inc.,” you must adopt a new playbook. We’ve distilled five surprising but essential rules for modern work, drawn from the insights of leading thinkers on careers, business, and innovation. These counterintuitive truths provide a practical guide to building a resilient and fulfilling professional life in the twenty-first century.

——————————————————————————–

1. Security Is Spelled R-I-S-K

The fundamental flaw in the 20th-century security model was its concentration of risk in a single asset: one employer. The promise of lifelong loyalty in exchange for a steady paycheck was a form of “corporate welfare,” as author Daniel H. Pink describes it, where the organization buffers the individual from the market. This arrangement masks your true value and creates profound fragility. In today’s volatile economy, true professional security comes from a strategic diversification of your professional assets.

The 21st-century solution is to spread your risk “across a portfolio of projects, clients, skills, and customers.” A traditional employee is dangerously exposed; a single layoff means total economic collapse. A free agent, by contrast, is accountable directly to the market. The loss of one client is a survivable event, not a catastrophe. This is why LinkedIn cofounder Reid Hoffman argues that intentionally taking small, frequent risks acts as a strategic inoculation against a single, catastrophic shock. The old path to security is now the surest path to fragility.

Freedom, once a detour from security, is now a pathway toward security.

— Daniel H. Pink, Free Agent Nation

2. Stop Planning, Start Doing

Conventional career advice often begins with a demand for deep introspection: “find your passion” before you take any action. This approach, however, frequently leads to paralysis, not clarity. The modern alternative is a bias toward action.

Career expert Herminia Ibarra proposes a “test-and-learn” model, arguing that we are not discovering a single “true self” but rather testing a portfolio of “possible selves.” Self-knowledge comes from real-world experience, not abstract reflection. The key is to run small experiments. Instead of a high-stakes leap into a new field, Ibarra advises “crafting experiments”—trying out new roles and activities on a small scale, often as side projects, before making a major commitment.

This strategy mirrors the tech industry concept of “permanent beta,” a term Reid Hoffman uses to describe how products like Gmail are never seen as truly “finished” but are in a constant state of evolution. Our careers—and our identities—should be viewed the same way: not as a final product to be designed, but as a dynamic project that is always a work in progress.

We learn who we are— in practice, not in theory— by testing reality, not by looking inside.

— Herminia Ibarra, Working Identity

3. Embrace Your Inner “Slash”

In her book One Person/Multiple Careers, author Marci Alboher introduces the “slash” career to describe professionals who juggle multiple identities. Far from being a sign of indecisiveness, having a portfolio of roles is a powerful strategy for building a more balanced, resilient, and fulfilling life.

Consider the case of Dan Milstein, a computer programmer/theater director. The different sides of his career provide complementary benefits that prevent burnout. As he explains, programming involves “solving puzzles and the beautiful abstract understanding of complex things,” but after a while, that work can feel “arid.” He then gets excited to return to theater, which is about “people, telling stories, bouncing things around…vagueness and uncertainty, with all of these egos.” This balance creates a whole that is greater than the sum of its parts. Alboher observes that people with slash careers often seem more satisfied and less oppressed by their work, precisely because they aren’t relying on one role to meet all their needs.

Basically, if I weren’t doing both things, I’d get bored and antsy.

— Dan Milstein, computer programmer/theater director, from One Person/Multiple Careers

4. Your Loyalty Belongs to Your Network, Not Your Logo

In the old corporate world, loyalty was vertical—it flowed up the org chart. In the new world of work, effective loyalty is horizontal—it flows outward to peers, colleagues, and professional communities.

Management thinker Tom Peters puts it bluntly: your personal brand is defined by your network. He argues that “Rolodex Loyalty” has become far more important than “logo loyalty.” The logic is simple and powerful: your job is temporary, but your profession is for life. A physicist’s primary allegiance is to the global community of physicists, not to the university that happens to employ her this year.

This is why your “weak ties”—the acquaintances and looser connections in your network—are so valuable. Citing the foundational research of sociologist Mark Granovetter, Reid Hoffman explains that these relationships are often the source of our best opportunities. Your immediate circle often knows the same things you do, but your weak ties are gateways to entirely new clusters of information and possibility.

This helps explain why membership in professional associations (based on occupation) is rising as sharply as membership in labor unions (based on employer) is falling.

— Daniel H. Pink, Free Agent Nation

5. Treat Error as a Feature, Not a Bug

We have a romantic but deeply misleading myth about how innovation happens: the “eureka” moment. In reality, as science writer Steven Johnson explains, breakthrough ideas are rarely flashes of brilliance. They are more often “slow hunches” that need time and connection to other ideas to mature into something transformative.

This process is inherently messy. Groundbreaking discoveries often emerge from mistakes and accidents. Alexander Fleming’s discovery of penicillin, for example, began not with a brilliant hypothesis but with a mold that accidentally contaminated a culture in his lab. This principle applies directly to building a career. As author Tim Harford argues, progress in complex domains is an evolutionary process of variation and selection. The “right” path is not found through flawless planning; it is discovered through adaptation. Mistakes should not be framed as failures, but as necessary variations. They are the market feedback that allows you to learn, adjust, and let the professional environment “select” for what truly works.

A shockingly large number of transformative ideas in the annals of science can be attributed to contaminated laboratory environments.

— Steven Johnson, Where Good Ideas Come From

——————————————————————————–

Conclusion: Your Next Experiment

A modern career is not a ladder to be climbed, but an entrepreneurial journey of adaptation, experimentation, and connection. As the CEO of You, Inc., your success depends on a fundamental shift in mindset. It’s a move from risk-aversion to intelligent diversification; from exhaustive planning to active experimentation; from a single job title to a portfolio of identities; from corporate fealty to network loyalty; and from fearing failure to embracing it as the engine of learning.

This new reality requires a new question. Instead of asking “What’s my next career move?”, what if the real question is, “What’s my next experiment?”

Understanding the Architecture of Data Warehousing

Data Warehouse Explanation :Data Science & AI Blog

Data warehousing is critical for businesses looking to harness data for strategic decision-making. A data warehouse is a centralized repository that integrates current and historical data from multiple sources. It enables data analysis and supports business strategies by providing a unified platform for insights and decision-making. The process and structure of data warehousing can be complex, but let’s break it down with the help of a visual guide.

The Journey of Data: From Source to Insight

      1. Data Sources: It all starts with the data sources, which can be diverse. In our image, we see three primary types: Online Transaction Processing systems (OLTP), flat files, and enterprise resource planning (CRM/ERP) systems. These sources contain raw, operational data that reflect day-to-day business transactions and interactions.

      1. Extraction, Transformation, and Loading (ETL): In the ETL process, experts extract, transform, and load data. They cleanse, reformat, and integrate the data to ensure consistency. The staging area, as shown in the image, is the intermediary holding area where this process takes place.

      1. Data Storage: After ETL, data moves into the data warehouse storage. Here, we see it divided into two key components:
            • Bottom Tier: This is where the actual storage of data occurs. It comprises the Raw Data, Summary Data, and Metadata. Raw data is the detailed data, summary data is the aggregated or calculated data, and metadata is the data about the data, providing context and definition.

            • Data Marts: These are subsections of the data warehouse, often tailored to specific business lines or departments. They allow for quicker access to data relevant to specific queries or reports.

        1. Data Access and Analysis: The top tier is where the action happens. This is the interface through which businesses interact with their data.
              • Online Analytical Processing (OLAP): OLAP tools help in complex querying and offer multidimensional data analysis, allowing users to view data from different perspectives.

              • Data Mining: This involves exploring large sets of data to find patterns and relationships that can lead to actionable insights.

              • Analysis and Reporting: Finally, the analyzed data is presented through reports and visualizations, aiding in decision-making and strategy formulation.

        The structure of a data warehouse is designed to support business intelligence activities efficiently. From the initial data sources to the final analysis, each stage in the data warehouse architecture plays a crucial role in transforming raw data into valuable insights.

        Welcome Mixtral-a Mixture of Experts on Hugging Face : Data Science & AI Blog


        01.12.2023

        Mixtral-8x7B-v0.1 Model Outperforms GPT-3.5!

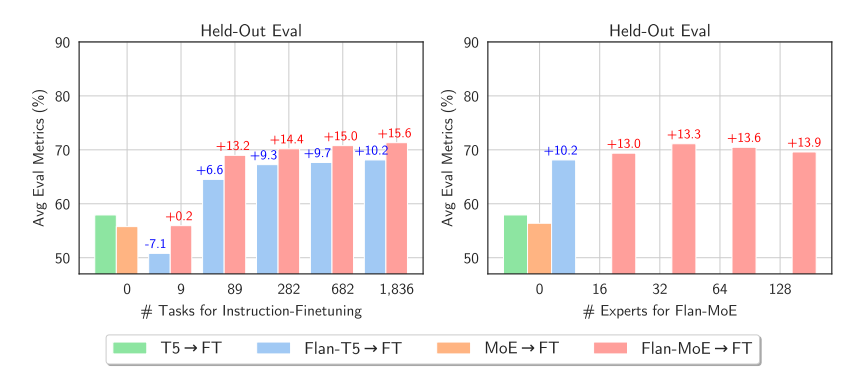
        Mistral.ai recently introduced the Mixtral-8x7B-v0.1 model, built using eight 7-billion-parameter Mistral models with a sparse mixture of experts (SMoE) approach. This model outperforms the 70-billion-parameter Llama and GPT-3.5 in most benchmarks and can now run locally with sufficient RAM and GPU. Initially shared via a torrent link, Mistral later provided detailed documentation following strong community interest. The model uses a Mixture of Experts (MoE) technique to combine eight expert models. The transformer architecture integrates two experts per token in each layer using the Mixture of Experts (MoE) technique. This replaces standard feed-forward layers, improving model efficiency and specialization by leveraging the expertise of selected models for specific tokens.

        Data Science & AI Blog: Mixture of Experts(MoE)

        The MoE layer includes a routing network that selects which expert processes which tokens. This technique allows for an increase in parameters while controlling costs and speed, as the model only uses a portion of the total parameters for each token. As I mentioned, in Mixtral, two experts are selected at each moment, allowing decoding speed similar to a 12.9 billion model, even though it has four times more parameters (46.7 billion). Some mistakenly thought it had 56 billion parameters (8*7), but this is incorrect as only some feed-forward layers are repeated, not all parameters. If you’re a bit confused about MoE, don’t worry, I’ll explain it in detail in another post. That covers two of your requests.

        We’re excited to inform you that both the base model and the Instruct model have been released. The context length is now 32,000. It performs equally or better than the 70-billion-parameter Llama2 and GPT-3.5 in most benchmarks. The results are attached below this post. It understands five languages: English, French, German, Spanish, and Italian (presumably trained on the togethercomputer/RedPajama-Data-V2 dataset, but that’s just my guess). It also performs well in coding tasks, reaching a score of 40.2 in HumanEval.

        Data Science & AI Blog: Average Eval Metrics

        Lastly, it has been released under the Apache2.0 license for everyone’s benefit. The Instruct model has its own prompt format, which you can find in the links I’ve provided at the end. Like the Mistral 7B, we don’t know the dataset size, how it’s been preprocessed, or what data it includes for sft and DPO (for fine-tuning). The code for loading and inference is also in the links, but note that you’ll need at least 30 GB of RAM and a GPU like the A100.

        Model release blog post link:
        https://mistral.ai/news/mixtral-of-experts/

        Link to the base Mixtral-8x7B-v0.1 model:
        https://huggingface.co/mistralai/Mixtral-8x7B-v0.1

        Link to the Mixtral-8x7B-Instruct-v0.1 model:
        https://huggingface.co/mistralai/Mixtral-8x7B-Instruct-v0.1

        Hugging Face blog link:
        https://huggingface.co/blog/mixtral

        25.11.2023

        A coronal mass ejection (CME) is a significant ejection of magnetic field and accompanying plasma mass from the Sun’s corona into the heliosphere 1. When a CME enters interplanetary space, scientists refer to it as an interplanetary coronal mass ejection (ICME). ICMEs are capable of reaching and colliding with Earth’s magnetosphere, where they can cause geomagnetic storms, aurorae, and in rare cases damage to electrical power grids 1. CMEs can travel at speeds ranging from slower than 250 kilometers per second (km/s) to as fast as near 3000 km/s 1The fastest Earth-directed CMEs can reach our planet in as little as 15-18 hours, while slower CMEs can take several days to arrive 1. [1] https://en.wikipedia.org/wiki/Coronal_mass_ejection.

        CME on the way

        22/10/2023

        I was in UTS Techlab. UTS Tech Lab is a multidisciplinary research facility that supports bespoke industry-led partnerships designed to drive innovation and growth in engineering and IT 1. Partners gain access to cutting-edge equipment, funding opportunities, world-class research talent, and the ability to commercialize foreground IP 1. Tech Lab provides industry partners with access to experts, labs, specialist equipment, funding opportunities, student talent, and office space. It brings together diverse engineering and computer science fields to facilitate a multidisciplinary approach to problem-solving. [1] https://techlab.uts.edu.au/

        Tech Lab

        Data Science

        20.12.2020

        Data Scientist:

            • Statistical analysis

            • Computer programs / Coding

            • ML algorithms

          Data Analyst:

                      • Large Data for business decision
                      • DBM SQL
                      • Complex business questions
                      • Communicate with data
                      • Between practical and theoretical aspects of data science

            Data Engineer:

                      • Developing systems

                      • DB management

                      • IT Engineering background

              Machine Learning Engineer:
                        • Computer engineer

                        • Software developer

                        • Coding & algorithm

                Corona Virus


                Click Here – Live Dashboard

                JHU made a useful dashboard about Coronavirus. estimated that it would reach New Zealand, Iran, Indonesia, Turkey, Spain and Switzerland. However, nobody has been reported until now. Hopefully, it doesn’t reach to more countries. So, keep safe everyone! although, based on the probability theory and the law of saturation, the probability of getting this virus is very low for people of other countries except for Wuhan. David.

                Update January 31: Modeling the Spreading Risk of 2019-nCoV

                By Lauren Gardner, January 31, 2020

                Collaborators

                This work is being led by Lauren Gardner at Johns Hopkins University CSSE, in collaboration with Aleksa Zlojutro and David Rey at rCITI at UNSW Sydney, and Ensheng Dong at JHU CSSE. At JHU, we have previously developed an interactive dashboard mapping the outbreak in real-time, and a written a blog.

                Model Implementation

                This work builds on our previous analysis posted on January 26. We implemented a previously published model that integrates both outbreak dynamics and outbreak control into a decision-support tool for mitigating infectious disease pandemics at the onset of an outbreak through border control to evaluate the 2019-nCoV epidemic. A stochastic metapopulation epidemic simulation tool simulates global outbreak dynamics, incorporating airport entry screening to identify infected or at-risk individuals. A detailed description of the model is provided at the end of this section.

                Our metapopulation model uses a global network of city-level populations connected by air travel routes, with outbreak dynamics modeled locally using a discrete-time SEIR framework. Air travel data from IATA informs the network’s weighted edges. Key parameters include a 5-day incubation and recovery period, with an effective reproductive number of 2, based on estimates from Imperial College London and NEJM. Initial cases are assumed to be in Wuhan, with no border controls. Results are averaged over 250 simulations.

                Results

                The results presented in this analysis are based on the 100 total cases of 2019-nCoV reported outside of mainland China on January 29. Specifically, we estimate the expected number of cases in mainland China at the end of January, as well as the global distribution of the infected travelers.

                We believe the actual number of 2019-nCoV cases in mainland China are likely much higher than that reported to date. Specifically, we estimate there to be around 58,000 cumulative cases of 2019-nCoV in mainland China by the end of January (as of January 31, the reported cases is close to 12,000). This estimate is in line with our previous analysis on January 25, which estimated the proportion of reported to estimated cases to be close to 10%.  It is likely that part of this discrepancy is due to reporting delays. However, the substantially larger number of estimated cases suggest a majority of the cases may be mild (or asymptomatic), do not require seeking medical care, and thus are not reported. Furthermore, based on this analysis, we believe the outbreak began in November, and there were already hundreds of human cases of 2019-nCoV in Wuhan in early December. The estimated verses confirmed cases during January are presented in Figure 1.

                Data Science & AI Blog: Number of Cases

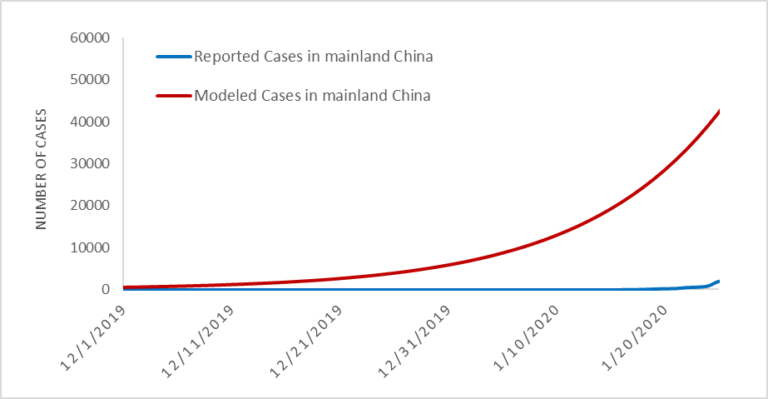
                Figure 1. Estimated vs. Reported Cases of 2019-nCoV cases globally.

                In addition to inferring the current outbreak size, the model provides the expected number of (the 100) imported cases arriving at each airport globally (based on final travel destinations of travelers). By aggregating this over all airports in a country/region we can estimate the total number of imported cases in each country/region. The country level importation risk is illustrated in the map in Figure 2, with the darker shades equating to higher importation risk, and the red outline indicating the set of countries reporting cases as of January 31.

                Data Science & AI Blog: 2019-nCoV Country Importation Risk

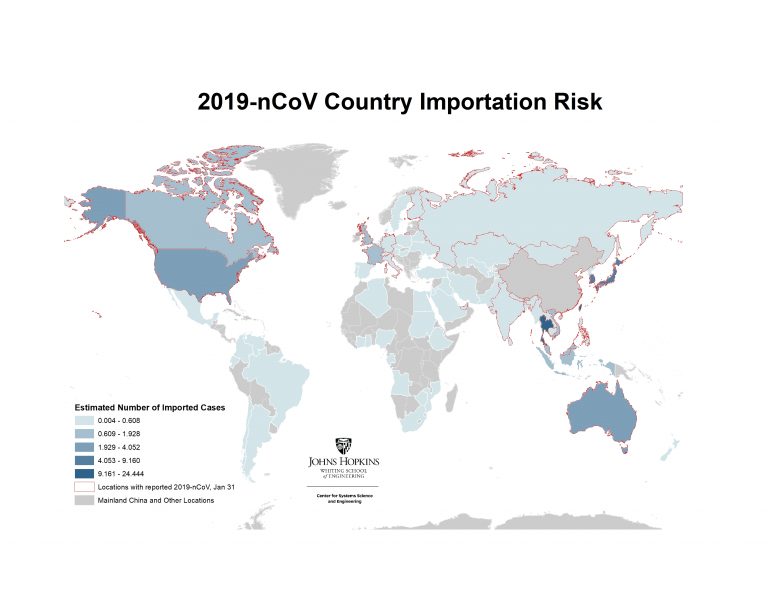
                Figure 2. Heatmap of Countries/regions with highest risk of imported 2019-nCoV cases, January 31

                Figure 3 below reveals how our estimated number of imported cases arriving in each country/region compared with the actual number of reported 2019-nCoV cases in each country. The simulation results align with the number of air travel reported cases outside of mainland China during the emerging stage of the epidemic. As of January 31, 24 countries excluding mainland China have reported at least one travel related case, with the list of affected countries consistent with our ranking. Some reported cases (shown as orange bars) were acquired locally in countries like the U.S., Germany, Japan, and Vietnam, contributing to the differences from our travel-related risk estimates.

                Data Science & AI Blog: Estimated Importation Risk vs Reported Number of 2019 CoV Cases by Country/ Region

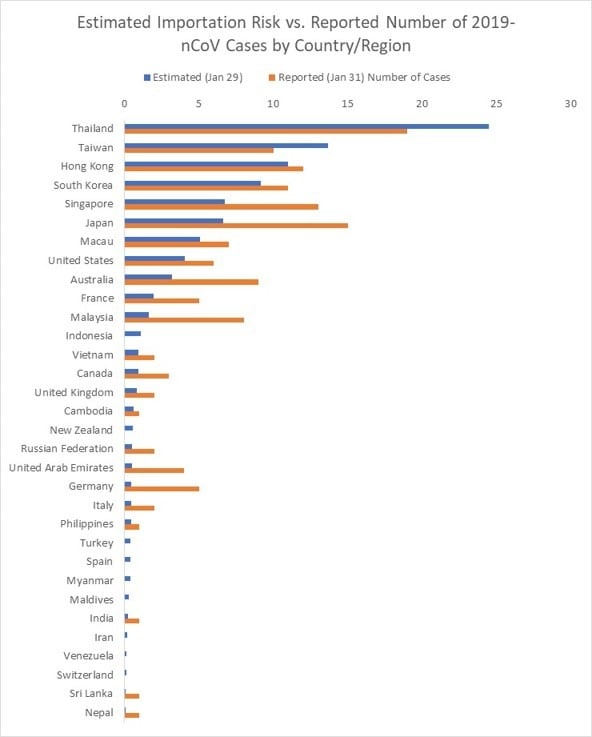
                Figure 3. List of Countries/regions with estimated number of imported cases vs. reported number of 2019-nCoV cases (as of Jan 31) 

                We further present the results at the airport level (based on their final travel destination), to identify the set of cities outside mainland China at highest risk of an outbreak. Figure 4 illustrates the set of cities within the U.S. at greatest risk of 2019-nCoV based on the expected number of arriving infected travelers at airports in the city, and the red outlines highlight the states that have already reported cases.  The set of at-risk airports outside mainland China are illustrated in Figures 5, with the primary risk posed to southeast Asia. Only a subset of U.S. airports are listed in the top 100 globally. These results are consistent with our previous analysis on January 25.  While many of these cities have already reported cases, they should be prepared for additional cases to be reported over the coming days, both in travelers whom departed Wuhan before the travel ban was implemented on January 23, and possibly through human to human transmission from infected travelers who arrived previously.

                Data Science & AI Blog : Risk of 2019 nCoV Importation in US Cities

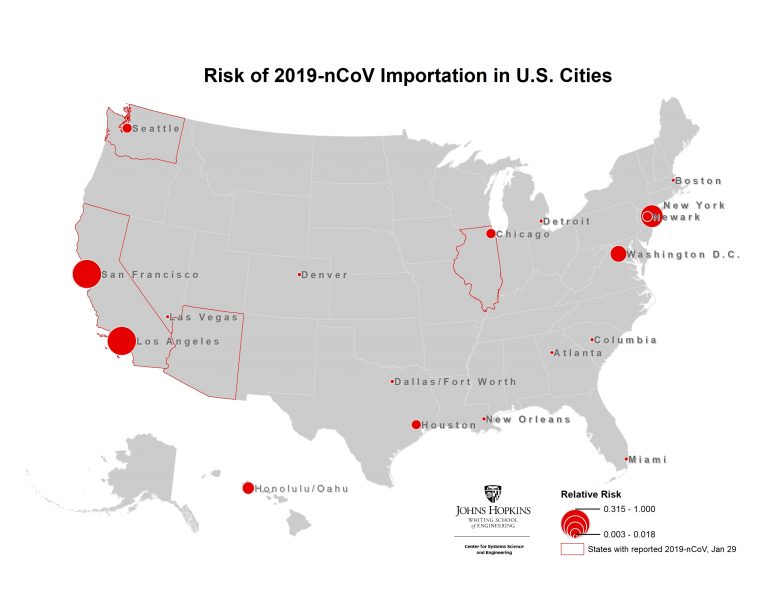
                Figure 4. Map of highest risk U.S. cities based on likelihood of 2019-nCoV arriving travelers

                Data Science & AI Blog : Map of highest risk U.S. cities based on likelihood of 2019-nCoV arriving travelers

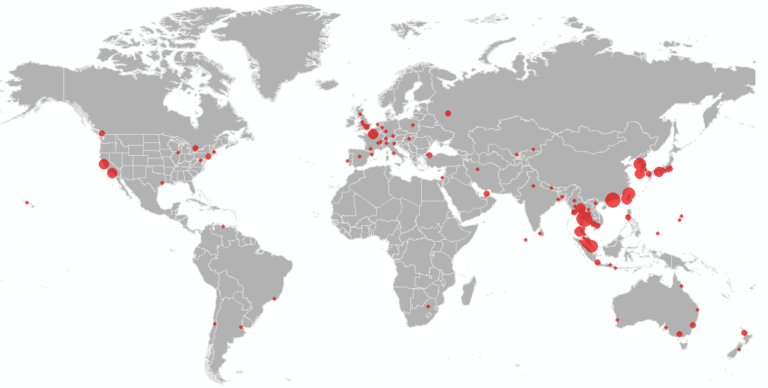
                Figure 5. Map of the airports at highest risk of 2019-nCoV arriving travelers outside mainland China.

                Limitations

                The estimates are based on several assumptions and modeling limitations that must be thoughtfully evaluated.

                • There is still uncertainty about the transmission of 2019-nCoV. The parameters for the reproductive number and incubation period chosen for this analysis align with the best estimates to date. There is less known about the duration of the recovery period, which may be longer than the five days specified in this analysis. More data will help us finer tune our estimates.
                • This analysis does not account for infection transmission by asymptomatic individuals during the incubation period, despite recent confirmation of this phenomenon. It is therefore likely the number of reported cases outside of China will increase in the coming days, especially in those cities identified to be at highest risk in this analysis.
                • The model only accounts for passenger air travel, and excludes mobility within and between cities via other modes of transport. Therefore, the spreading risk between regions connected via alternatives modes of travel is underestimated. This is most applicable to spread within China, which we are underestimating.
                • The SEIR parameters used to model the outbreak within each city are deterministic. However, the spread of infected travelers moving between cities is modeled stochastically.
                • The analysis does not account for the arrival passenger screening at airports or the complete air travel ban that authorities implemented in Wuhan on January 23. We are therefore likely overestimating the number of cases exported out of Wuhan during the last few days of our simulation. However, this is unlikely to impact the relative ranking of the destinations.
                • This analysis assumes no local control mechanisms (such as prophylactics, vaccines, school closures, or quarantine efforts) are in place within cities. Therefore, the R0 is treated as constant over time and consistent across all locations. It is likely R0 is highly variable between locations, and lower than it was at the start of the outbreak, due to changes in individual’s behavior. Additionally, some higher R0 estimates based on the early stages of the outbreak are likely an overestimate at this point in time. For this same reason we may be overestimating the growth of the outbreak over the last week, and therefore overestimating total cases.
                • We are using 2015 Travel data, because that is the most recent complete (airport-to-airport) data we had available in the lab.

                References:

                Zlojutro, A, Rey, D and L Gardner*. (2019) “Optimizing border control policies for global outbreak mitigation”. Scientific Reports 9:2216. DOI https://doi.org/10.1038/s41598-019-38665-w (Open Source link) https://rdcu.be/bniOs

                New Inventions

                Worlds of innovation

                You have to have a big vision and take very small steps to get there. You have to be humble as you execute but visionary and gigantic in terms of your aspiration.

                In the Internet industry, it’s not about grand innovation, it’s about a lot of little innovations: every day, every week, every month, making something a little bit better.

                Time is money

                02/04/2018 BUT THAT DOESN’T MEAN YOU HAVE TO WORK NON-STOP
                A key principle of labor is that time equals money: the less time you waste, the more tasks you accomplish, and the greater your earning potential becomes. Don’t dilly-dally! If there’s time for learning, there’s time for cleaning, as one popular barista equivalent goes. Benjamin Franklin, the great aphorist, often assigned the phrase in his 1748 essay “Advice to a Young Tradesman.” He wrote, “Remember that time is money,” and then went on to remind his youthful reader of the opportunity cost of laziness.. When you’re not working, he says, you’re just throwing potential earnings away. But the money-time equivalency had been a meme for quite a while before Franklin got his literary-kleptomaniacal hands on it. The connection between the two has never quite remained the same over the past two millennia, and in our age of digital labor, we’re redefining the relationship between time and money yet again.

                LIFESTYLE COMPANIES “BUILD A SUSTAINABLE REVENUE STREAM,” “STAY AS SMALL AS POSSIBLE,” AND “WORK HARD, BUT AIM TO MINIMIZE HOURS WORKED.”

                It’s feeling like past time for me to wrap up this blog, however. I’m still operating under the premise that time is very much money.

                12/05/2017

                Location is Everything

                2000s: Talking is cheap show me your code

                2026: Code is cheap show me your prompt

                2027: Prompt is cheap show me your GPU credit

                ​#NVIDIA
                ​#ComputeIsCurrency
                ​#H100
                ​#CloudComputing
                ​#AIInfrastructure

                Deconstructing Emotion via @YouTube

                Antigravity: Build any app in a minute via @YouTube

                TEQSA RPL Automation App via @YouTube

                AI Meets the Mind via @YouTube

                AI Meets the Mind https://youtu.be/S2KUOSOObiY?si=ZxY7xSZFmx_akm9J via @YouTube

                Cybersecurity in Big Data https://youtu.be/ar8PAEI5oZM?si=8nUfjevN-b04vAmv via @YouTube

                #AgenticAI,
                #CyberSecurity,
                #CloudSecurity,
                #CloudProtection,

                SpiderGNN: Seeing 5G Signal Through Walls via @YouTube

                Taming the Digital Deluge https://youtu.be/usfab542IQo?si=kBl6aaBYrrHRbsI1 via @YouTube

                Load More